Getting Started
Get up and running with Visionade in under 10 minutes. Follow these simple steps to create your first custom report.
Install from Atlassian Marketplace
Installing Visionade is quick and easy through the Atlassian Marketplace:
- Go to your Jira instance administration
- Navigate to "Find new apps" in the left sidebar
- Search for "Visionade" in the marketplace
- Click "Install" and accept the permissions
- Wait for the installation to complete (usually under 30 seconds)
Tip: You'll need Jira administrator permissions to install apps. If you don't have access, contact your Jira admin.
Setting Up Visionade
Once installed, configure Visionade for your first report:
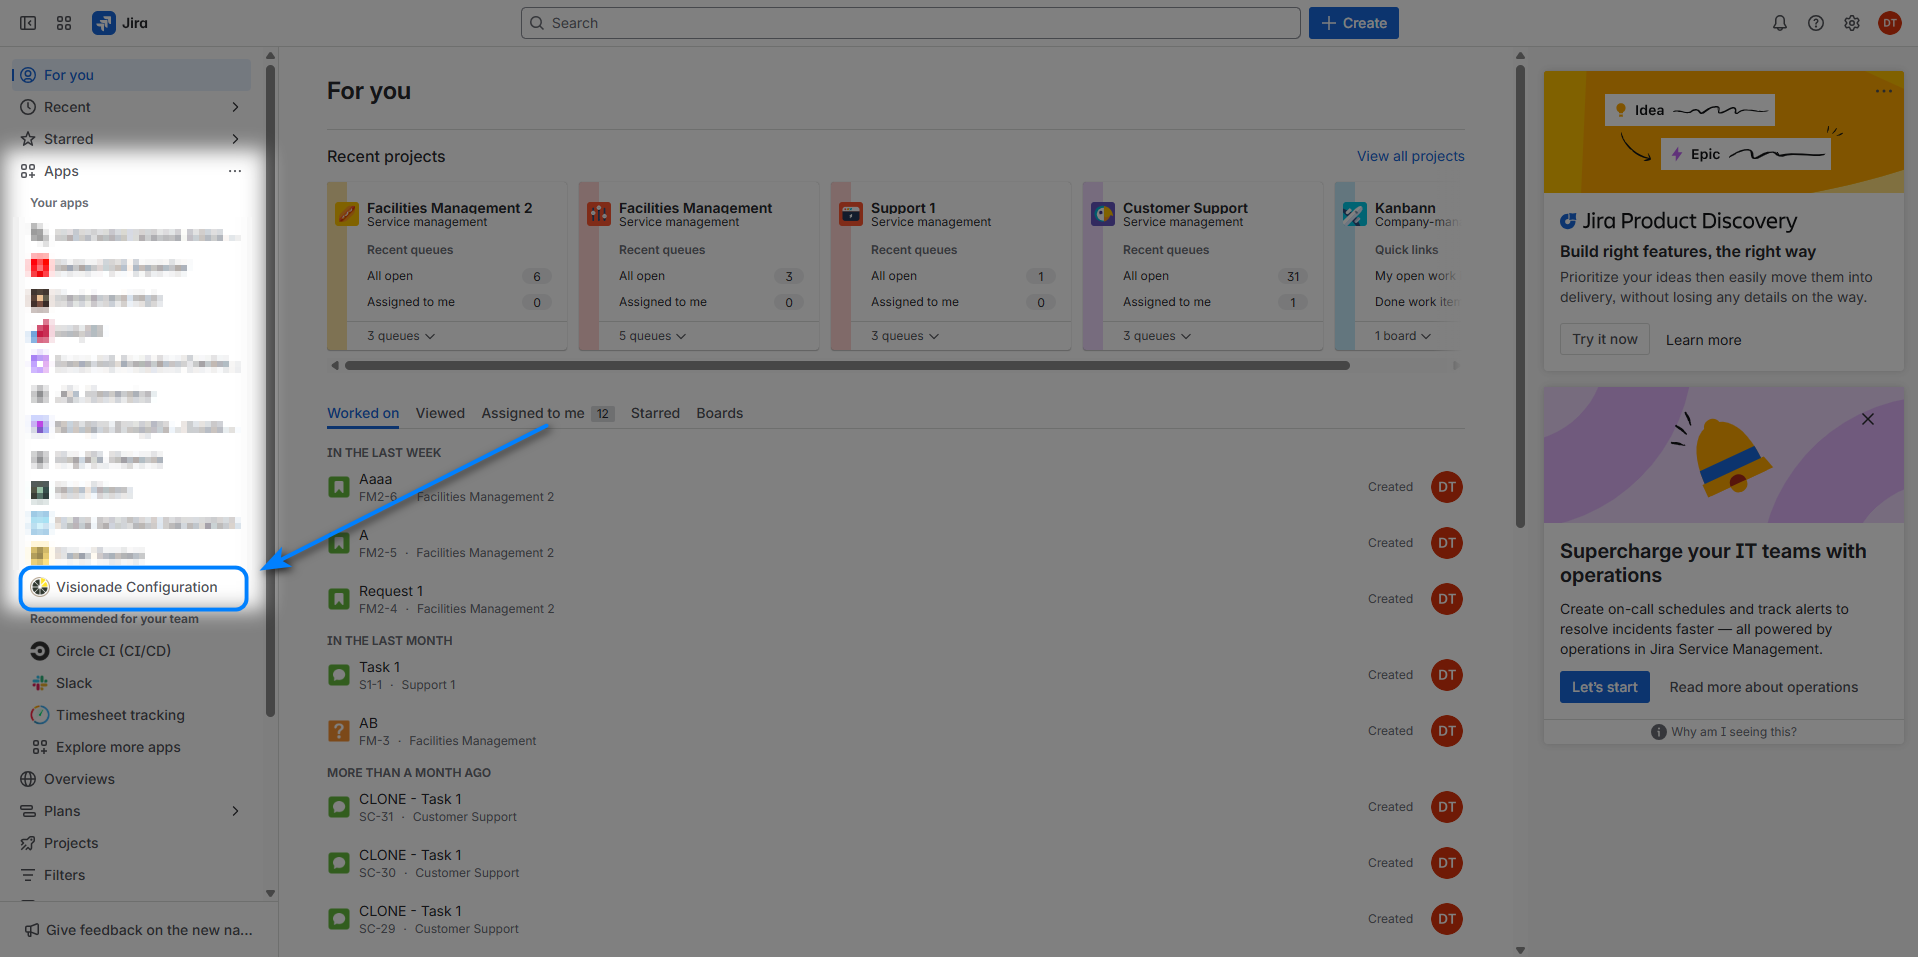
- Click on "Apps" in the navigation bar
- Select "Visionade" in Apps section
Connect to Data Source
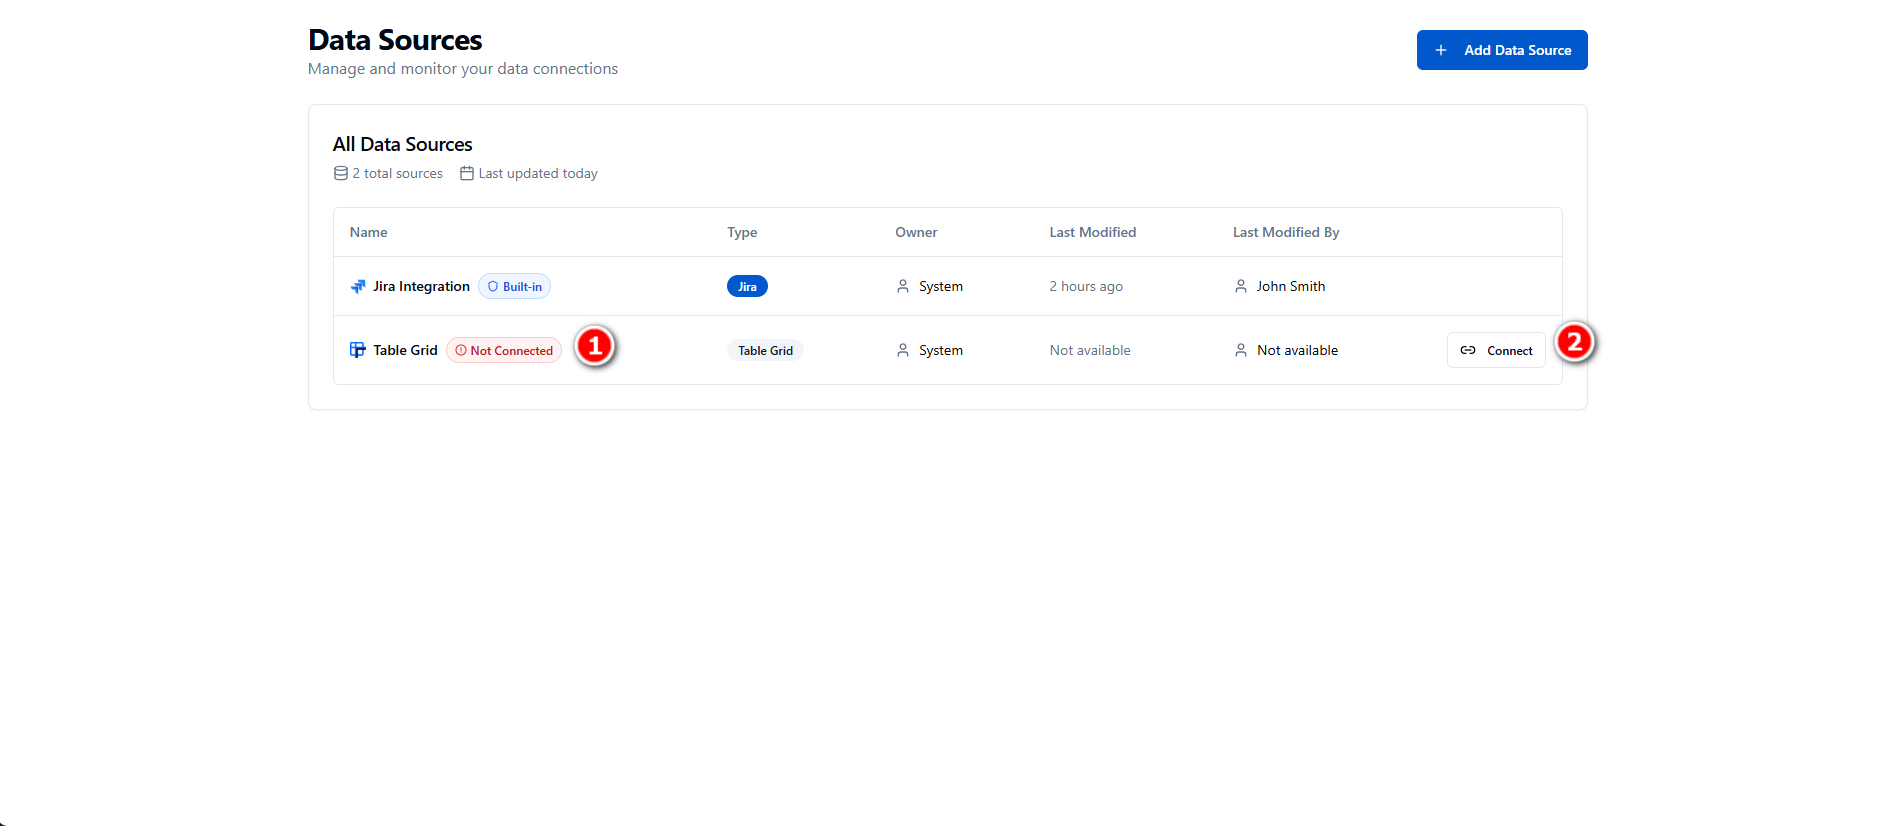
Configure your data connections to start building reports:
- Jira Projects: Jira data source will be connected automatically in default when you installs Visionade successfully.
- Table Grid: If Table Grid hasn’t been connected, it will display “Connect” button. Click on “Connect” button
Important: You can only connect and take data from Table Grid in your current Jira instance.
Configure Dimensions
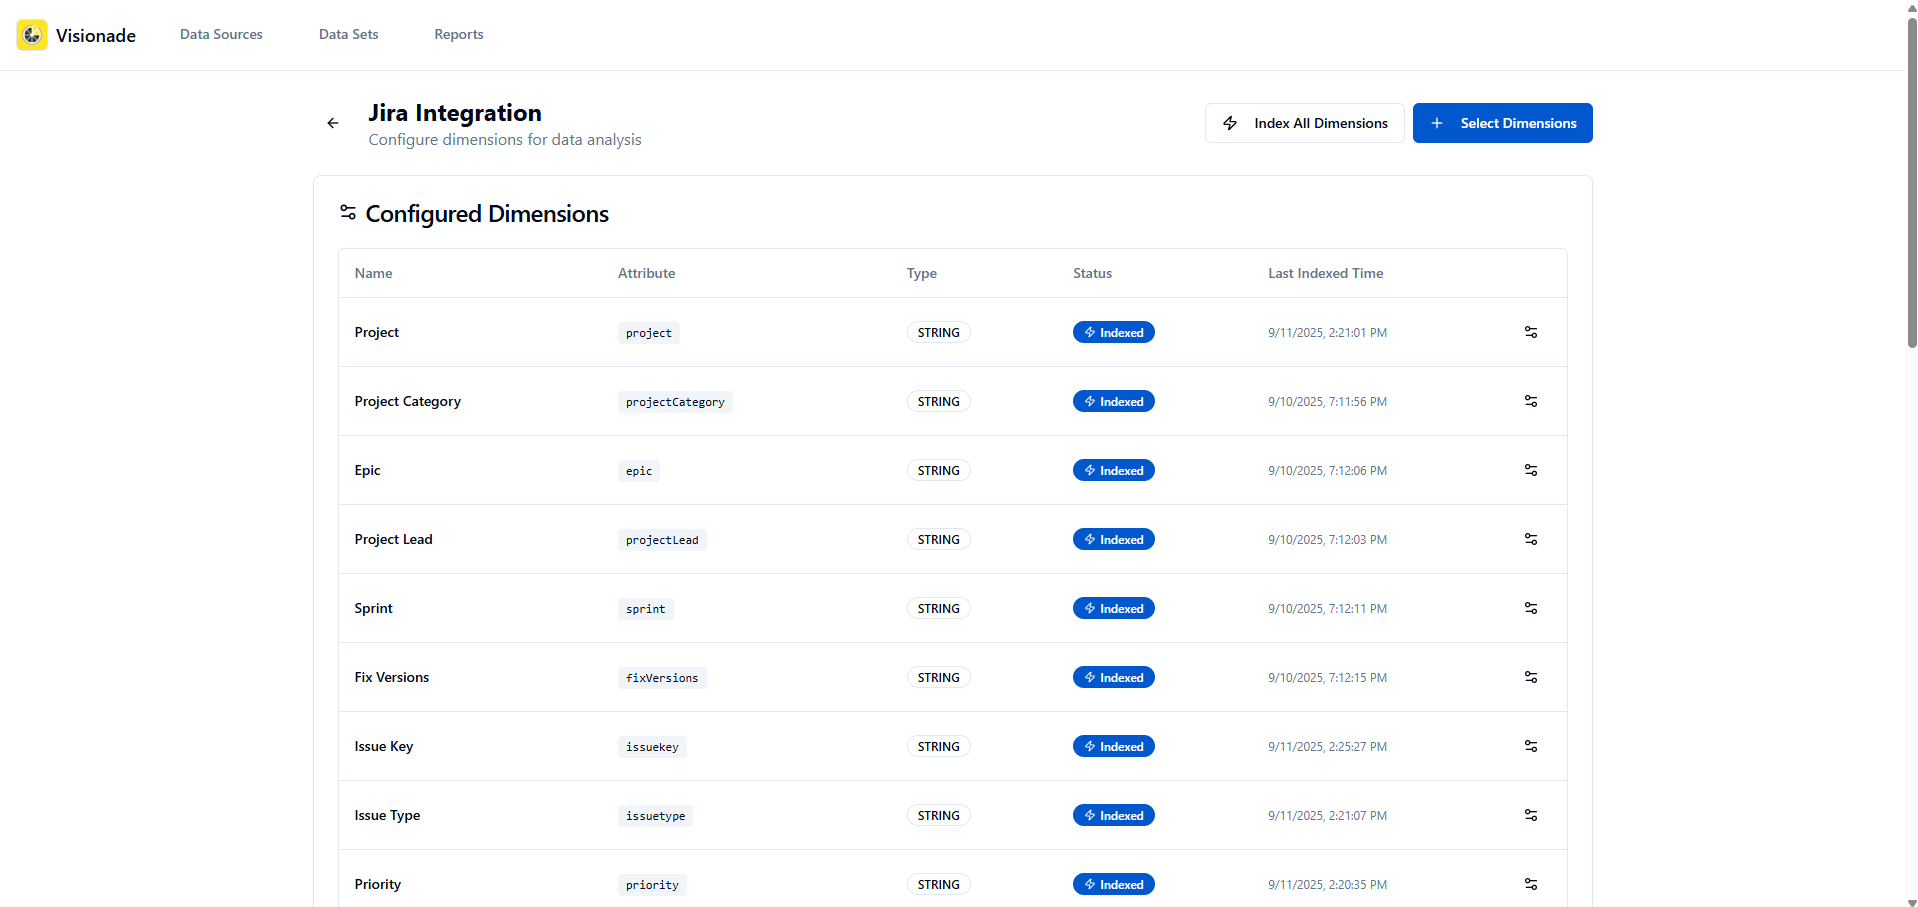
Configure your dimensions to use in reports:
- Open Data Sources tab, select a data source to open
- Select dimensions by checking the checkbox of each, then click “Save Selected”
- Index all dimensions to have last updated data
Tip: You can create custom dimensions from fields in Data Source, and grouping their values based on data type.
Configure Data Set
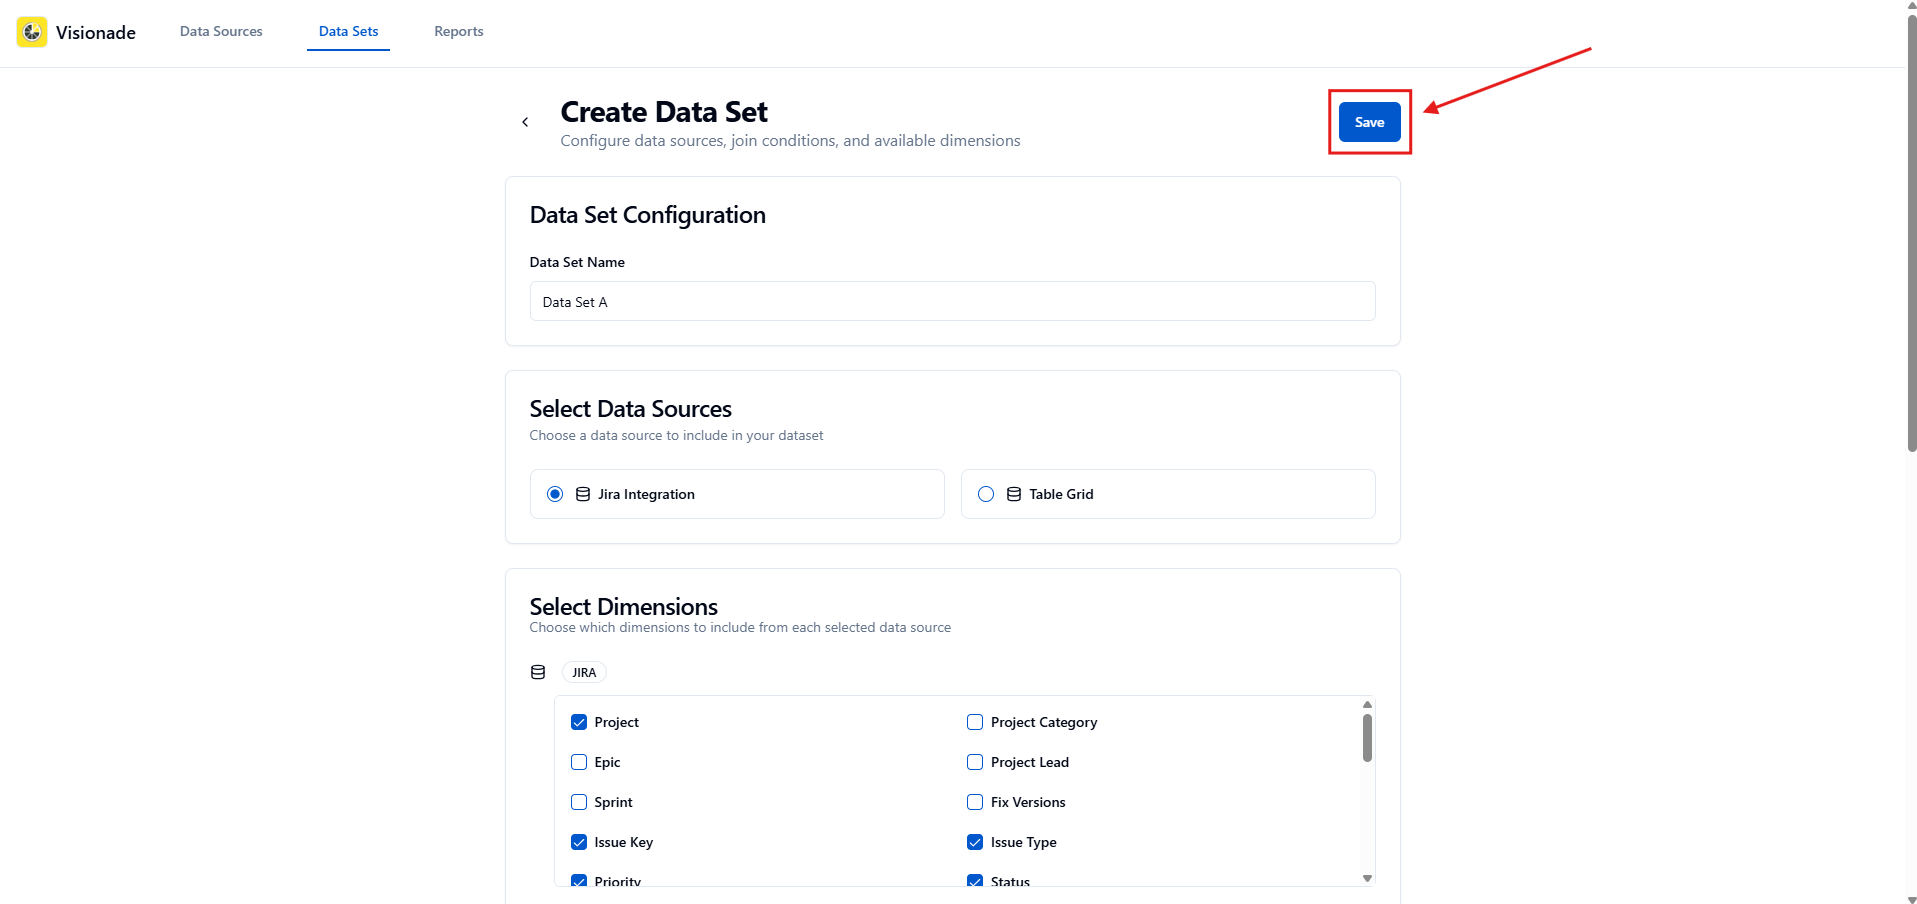
Set up your data configuration for reporting:
- Select your primary data source
- Select Dimensions based on the selected data source
- Type JQL query to narrow down data from data source
- Preview data based on data set configuration
Important: If you leave JQL query blank, it will query data with the following query: project is not empty
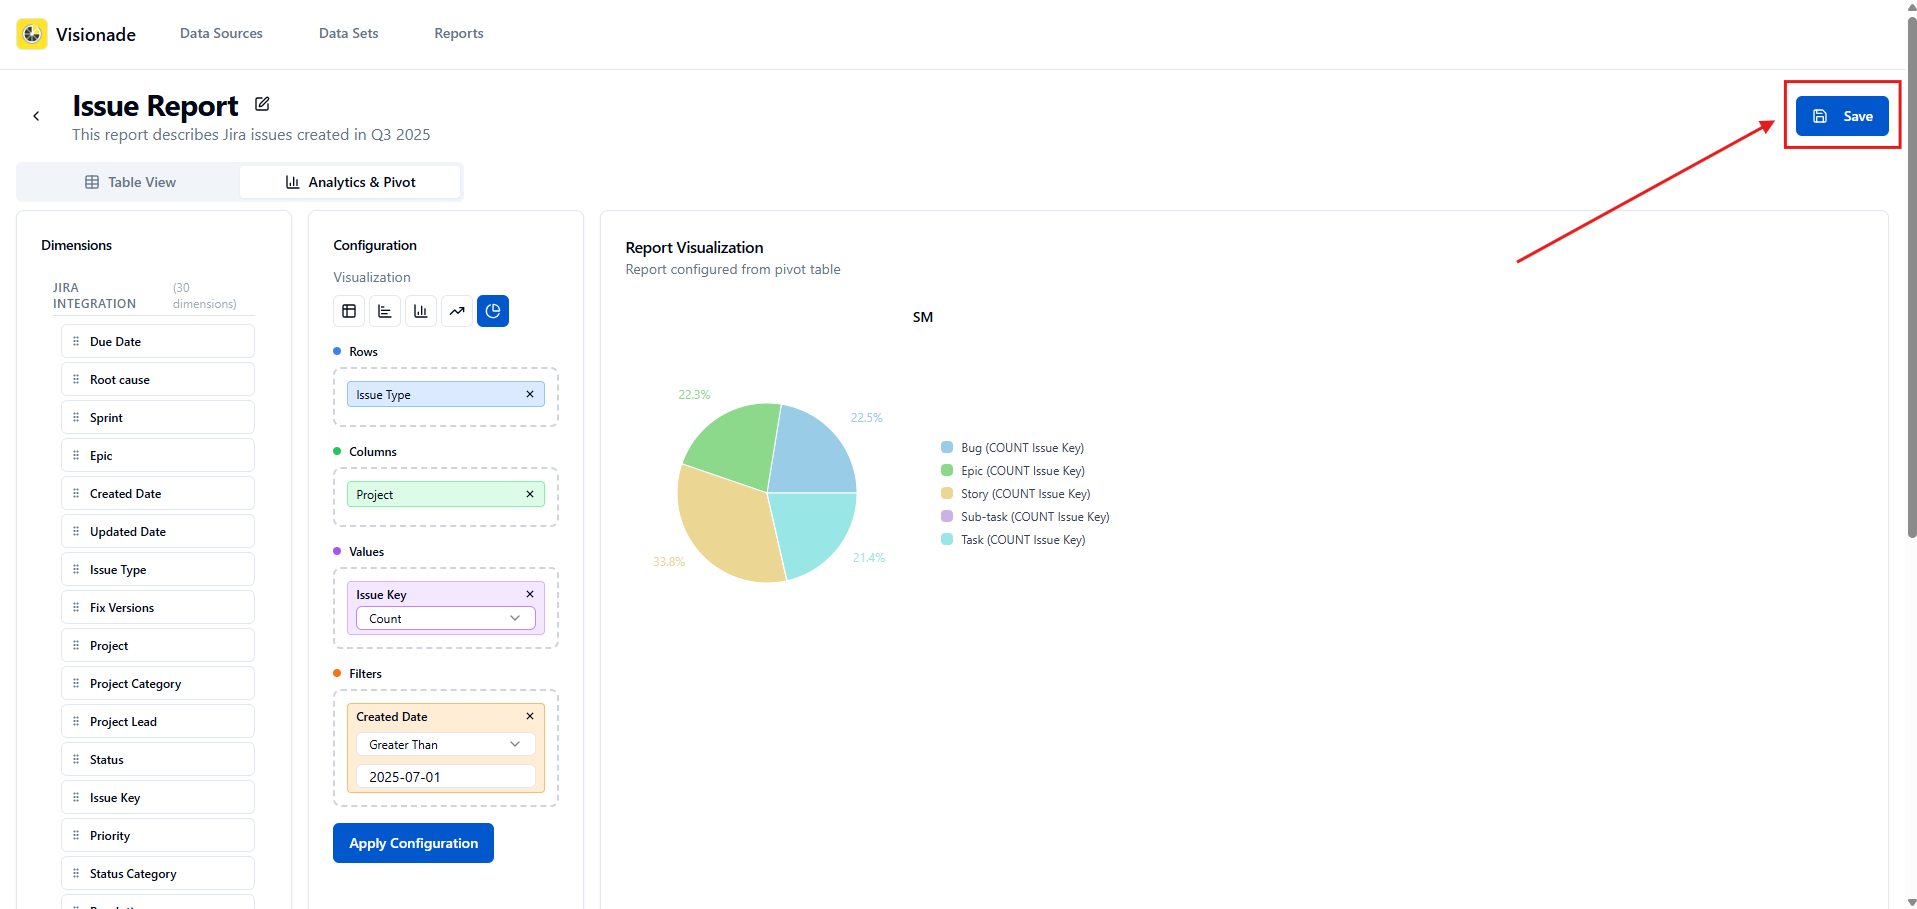
Configure Report
Create custom reports with drag-and-drop simplicity:
- Drag fields to appropriate section
- Select aggregations for Values dimensions (sum, average, count, min/max)
- Filter by dimensions
- Choose your chart type (bar, column, pie, line)
- Click "Apply Config"
- Preview and adjust your report
Pro Tip: Start with simple bar charts before moving to more complex visualizations.
Add Reports to Jira Dashboard
Integrate your reports directly into Jira dashboards:
- Go to your Jira dashboard
- Click "Add gadget"
- Select "Visionade Report" from the list
- Choose your configured report
- Adjust size and position as needed
Release History
Stay updated with the latest Visionade features and improvements:
External Link: For detailed release notes, visit the Visionade Release History on our wiki.
Troubleshooting & Support
Always getting supported
Common Issues
Report Not Loading
Issue: Report shows "Loading..." or displays no data
Solutions:
- Verify data source permissions
- Check if filters are too restrictive
- Ensure data exists for the selected time period
- Try refreshing the page
Chart Display Issues
Issue: Charts appear blank or incorrectly formatted
Solutions:
- Check field mappings in report configuration
- Verify calculation settings
- Test with default chart settings
- Clear browser cache if needed
Getting Help
Need additional support? Here are your options:
- Marketplace Support: Use the support tab on our marketplace listing
- Documentation Wiki: Visit our comprehensive Visionade wiki
- Email Support: Contact us at [email protected]