Data Stirred. Not Scrambled.
Refresh your data story in Jira—turn raw insights into clear actions with real-time reports, custom charts, and dashboards.
🛡️ Trusted by 2,500+ Exalate customers
Visionade gives your data fresh context, clarity, and shape. Turn raw insights into clear actions with custom reports and dashboards.
Visionade: Data, served fresh. Turn complexity into something sharp, bright, and energizing for better decisions.
Aggregate data from different Jira Projects, JQL filters, Table Grid tables, and external sources in real-time.
Custom reports with sum, average, count, min/max calculations. Multi-dimensional analysis with drag-and-drop interface.
See how easy it is to create custom reports and dashboards
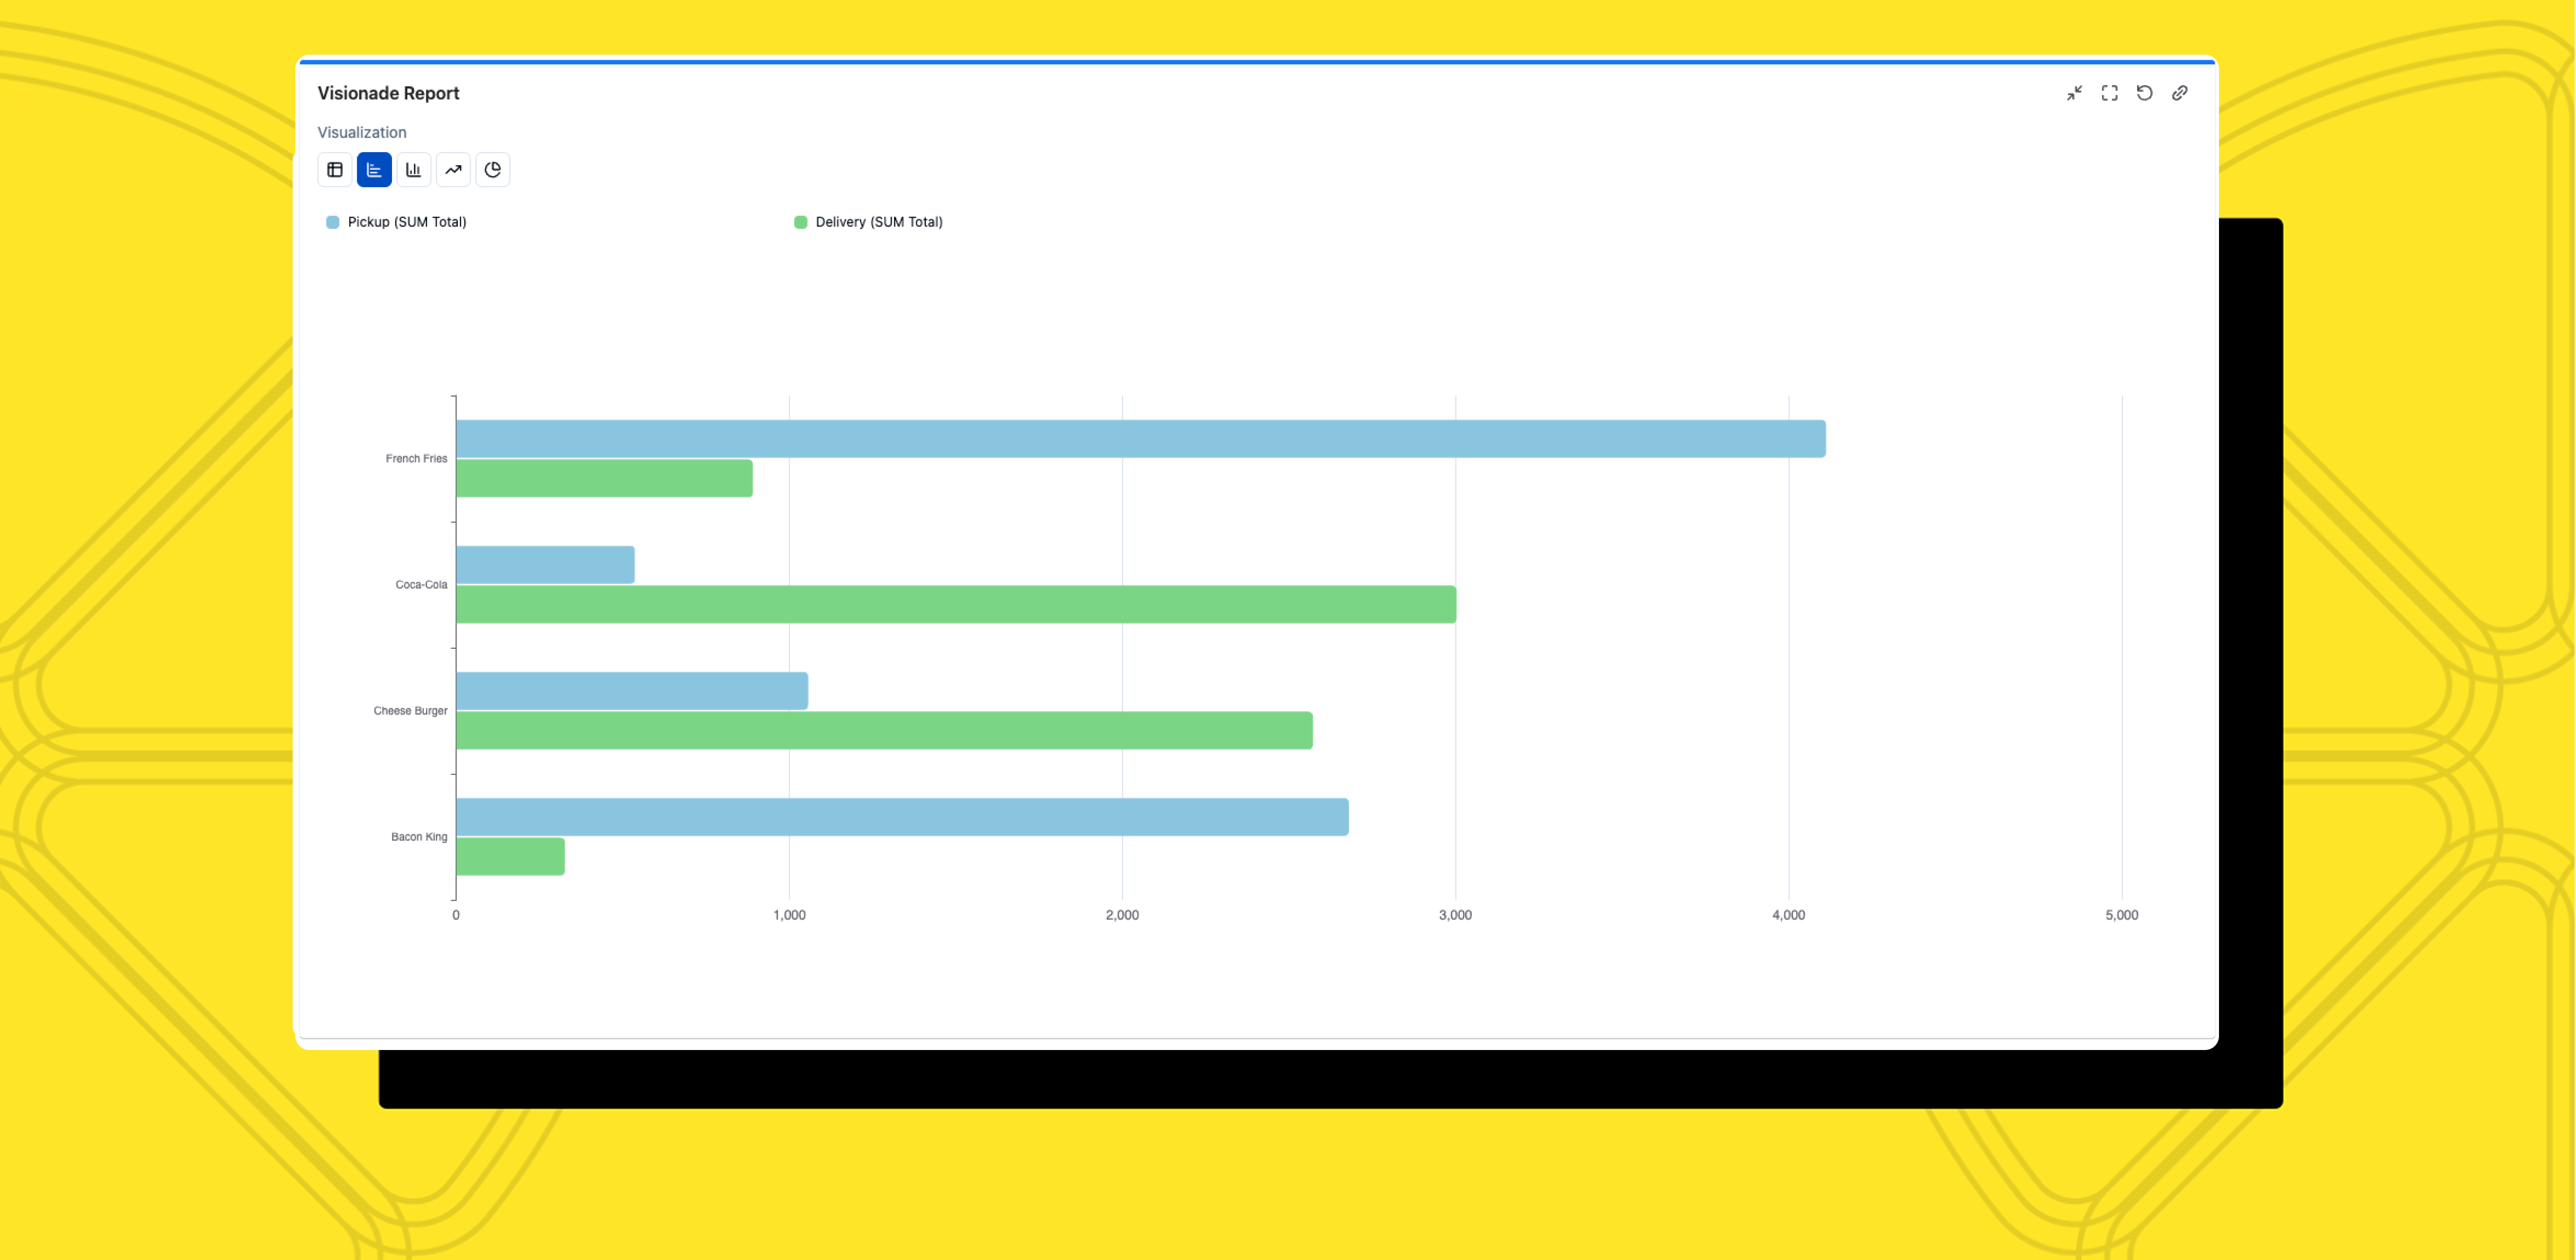
Sales Revenue of Menu Items by Order Types
Everything you need to turn Jira data into actionable insights
Create reports with sum, average, count, and min/max calculations directly in Jira without external tools.
Custom charts in Jira with bar, column, pie, and line visualization options for deeper insights.
Dynamic data summarization and in-depth analysis with powerful pivot table functionality.
Easy-to-use interface that requires no technical skills—just drag, drop, and discover insights.
Pull data from Table Grid tables alongside Jira projects for comprehensive reporting capabilities.
Leverage Jira Query Language filters to create targeted reports and focused data visualizations.
Turn raw insights into clear actions with real-time reports, custom charts, and dashboards.
✓ 30-day free trial ✓ No credit card required ✓ Available on Atlassian Marketplace