This document provides a step-by-step guide to generating a sales report for a burger restaurant, focusing on revenue breakdown by menu item. Using Visionade and Table Grid as data source, restaurant owners and managers can gain insights into their best-selling items, track revenue trends, and optimize their menu for better profitability.
📋 Table of Contents
📊 Introduction
Understanding which menu items drive the most revenue is crucial for a burger restaurant. A sales report by menu item allows business owners to make data-driven decisions, such as adjusting pricing, optimizing inventory, and launching targeted promotions. Visionade enables seamless data extraction from Table Grid and visualization within Jira Dashboards for real-time tracking.
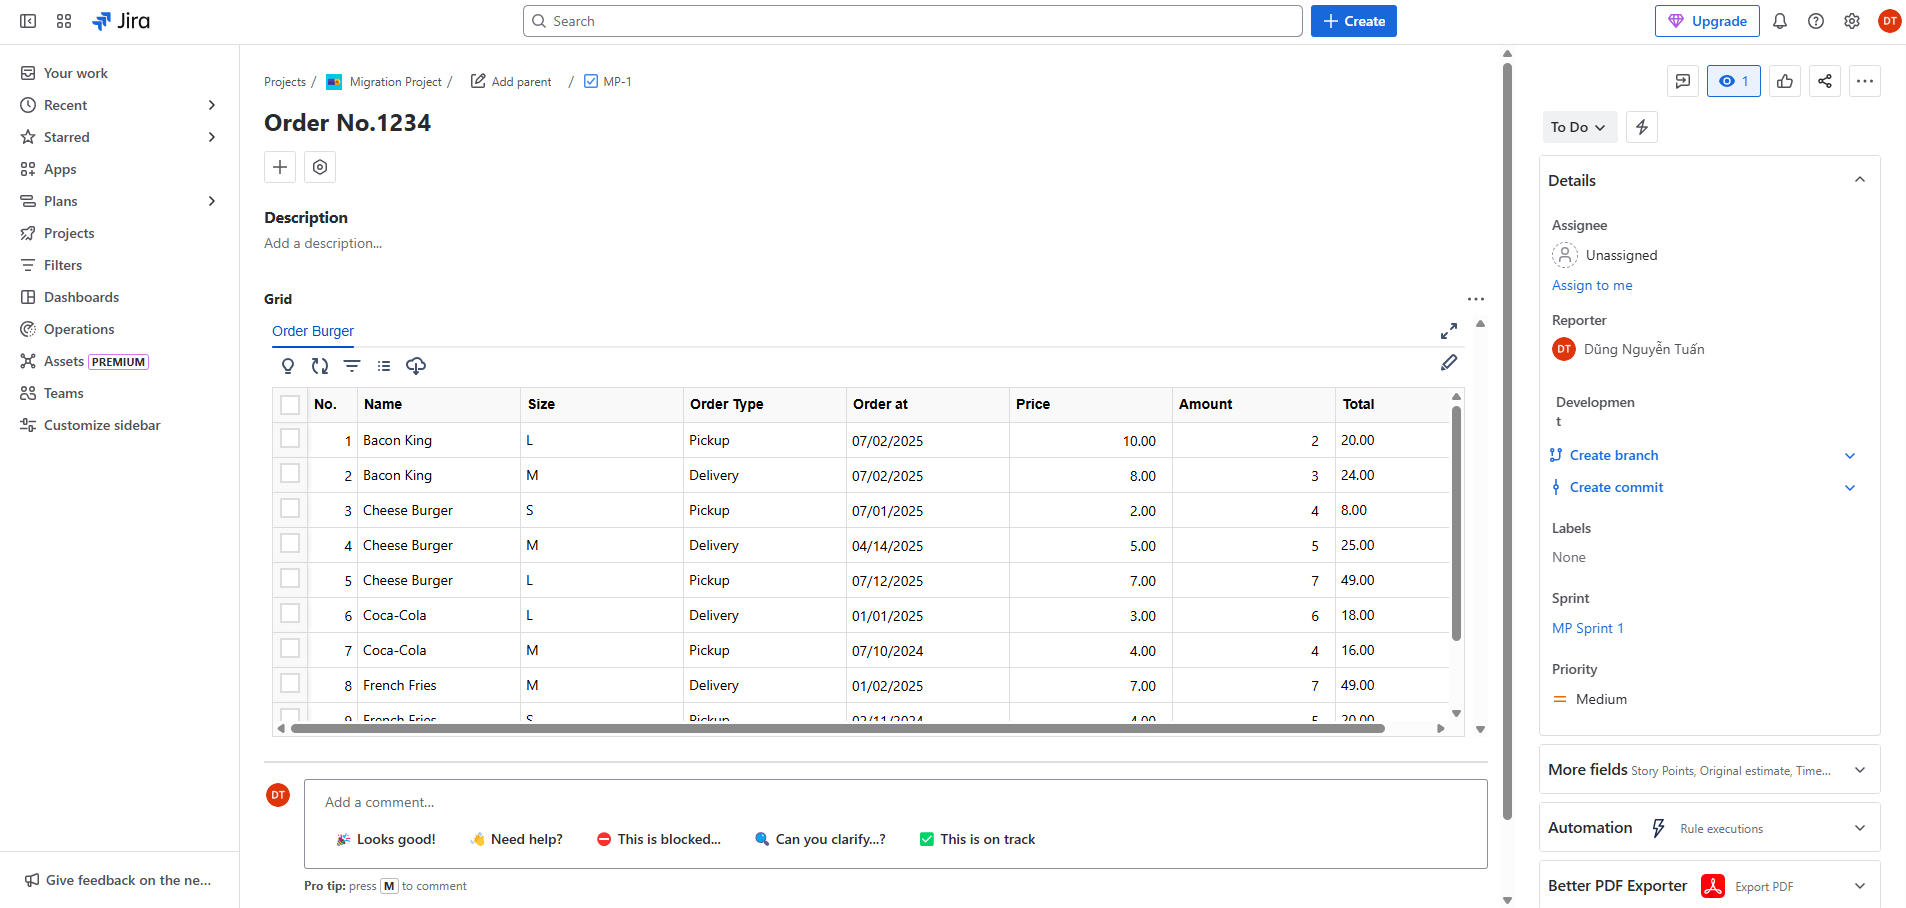
Orders will be managed on Issue Screen and displayed in grids like this:
💡 Pro Tip: This tutorial shows how to transform raw order data into actionable business insights using Visionade's powerful reporting capabilities.
✅ Prerequisites
Before generating the report, ensure the following conditions are met:
Visionade Installation
Visionade is installed and accessible within your Jira environment.
Table Grid Connection
Table Grid is connected and contains sales transaction data.
Admin Access
User has Jira Admin permission and has access Jira Dashboards.
Data Structure
Sales data structure includes key fields such as Item Name, Ordered date, Quantity sold, Price, and Total revenue.
🎯 Post-condition
- ✅ A dynamic sales report by menu item will be displayed on the Jira Dashboard.
- ✅ Configured report is saved in Reports list.
🔄 Use Case Flow Diagram
Configure Table Grid Source
Set up data source connection
Configure Data Set
Define data parameters and filters
Configure Report
Build analytics and visualizations
Add to Dashboard
Display report in Jira
🚀 Step-by-Step Implementation
Step 1: Configure Table Grid Data Source
Open Data Sources tab, click on Table Grid source
Click Select on grid "Order Burger Demo"
Click Select Dimensions button
Select dimensions and then click Save Selected
Click Index All Dimensions button to reindex the data of all selected dimensions, ensuring it is fully up to date.
Step 2: Configure Data Set
Open Data Sets tab, click Create Data Set button
Enter "Burger Orders" for Data Set Name
Select "Table Grid" in Select Data Sources section
In Select Grid field, select grid "Order Burger Demo"
Enter JQL query to narrow down the data set that you want:
key = (HNGTST-33, HNGTST-89, DU2-254, B2-43)
Then click "Run Query" or "Preview" button to filter and preview data in Data Preview section
Click Save to save data set configuration
Step 3: Configure Revenue Report
Open Reports tab, click Create Report button
Fill in Report Name and click Next button
In Table View tab, select data set "Burger Orders" that we have configured
Open Analytics & Pivot tab to start configuring report
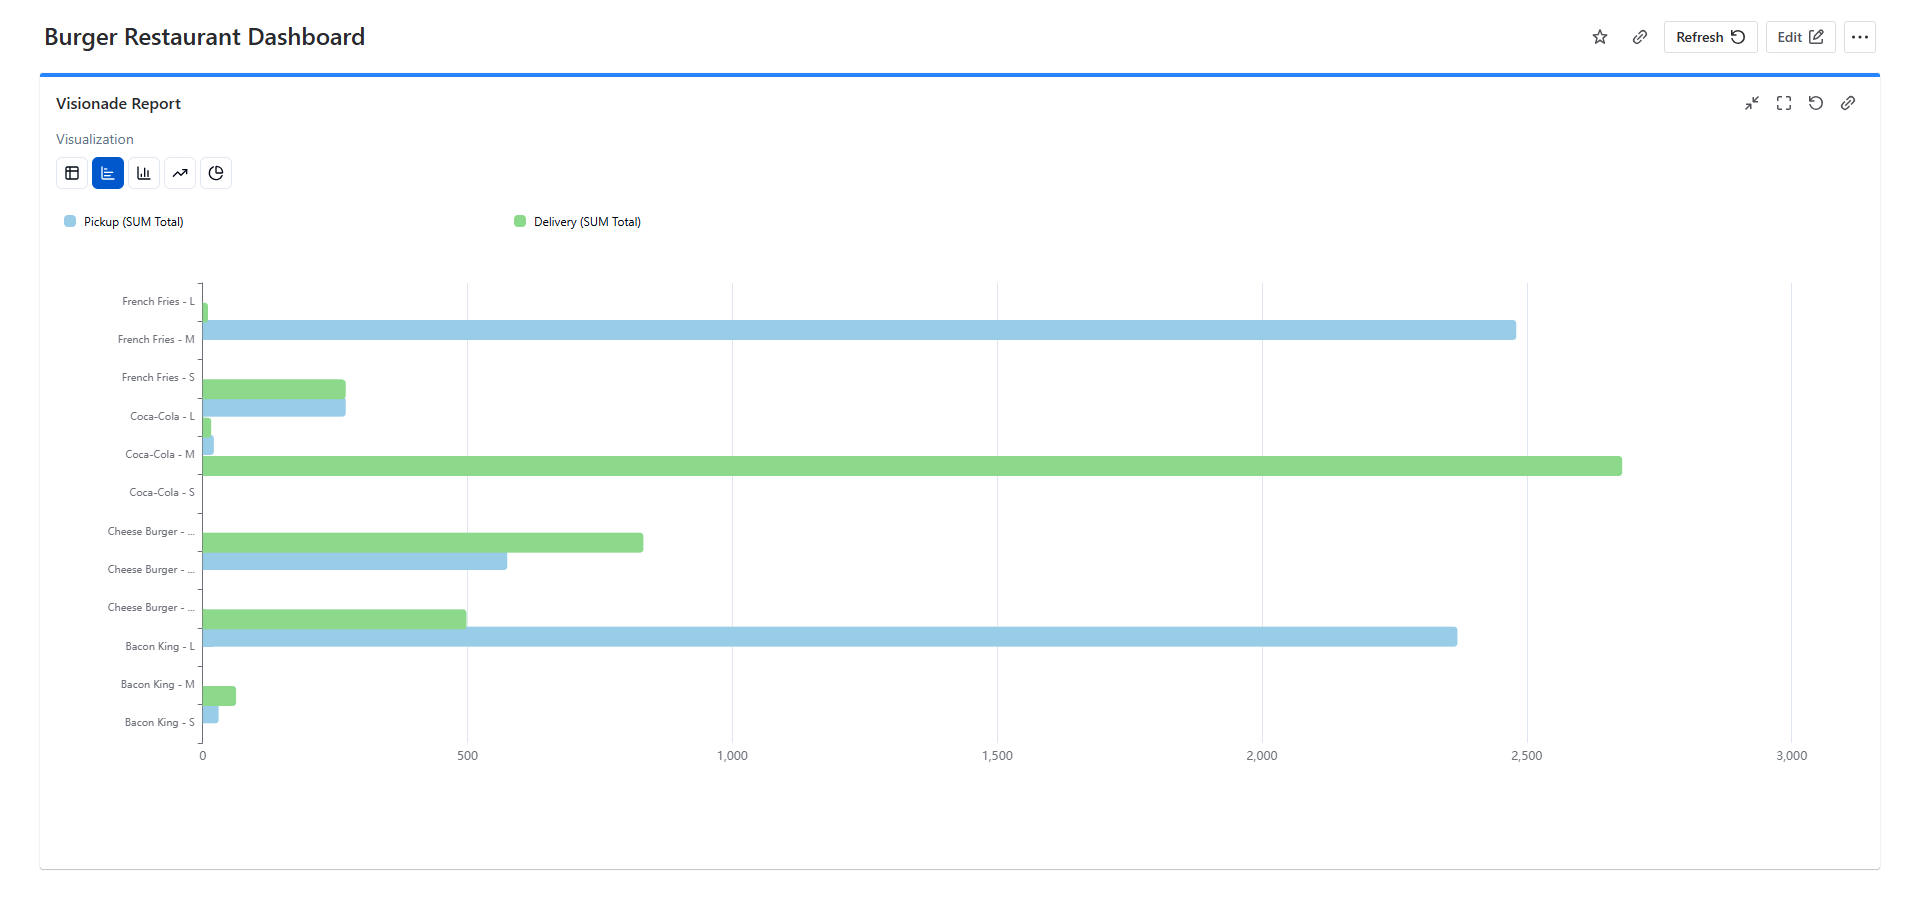
Drag dimension Name to section Rows to view menu item name as row headers
Continue to drag dimension Size to section Rows and below dimension Name to view size of each menu item
Drag dimension Order Type to dimension Columns to view order types as column headers
Drag dimension Total to section Values to view revenue in each field of the table
Select Sum in Aggregation field
Drag dimension Order at to dimension Filters to filter orders in 2025
Click on Order at dimension to select filter condition Date Is After and enter value "2025-01-01"
📅 Date Format: Use format YYYY-MM-DD
Select Bar Chart in section Visualization
Click Apply Config to generate report
Click "Save" to save report configuration
Step 4: Add Revenue Report to Jira Dashboard
Open Dashboards screen and click Create dashboard button
Fill in Name and click Save
Click Edit button to edit the dashboard
Search "Visionade" to search gadget
Click Add button on Visionade Report gadget
Select Revenue by Menu Items Report
Click "Save Changes" to save changes on gadget
Click "Change layout" and select "One column"
Click Done to save dashboard
Step 5: Result
🎉 Success!
Report is displayed on Jira Dashboard.
You now have a dynamic, real-time sales report that shows revenue breakdown by menu item and size, filterable by order type and date range.
🎯 Conclusion
By leveraging Visionade and Table Grid, burger restaurant owners can efficiently track sales performance by menu item. This report enables data-driven decision-making, helping businesses optimize pricing strategies, manage inventory effectively, and maximize profitability.
Ready to Transform Your Restaurant Data?
Start your free 30-day trial of Visionade and turn your raw data into actionable insights.
Get Started Free📚 More Details
For additional screenshots, detailed configurations, and troubleshooting tips, visit our comprehensive Confluence documentation.
📖 View on Confluence ↗